In a recent update to our JavaScript code, we had a special feature to handle split electoral votes for Maine and Nebraska. The goal was to allow users to split votes between Democratic and Republican candidates and display color gradients accordingly on a map. However, I encountered an unexpected issue where the map rendered a gradient color between blue and red even when all votes were assigned to Republicans. Here’s a breakdown of the problem, what caused it, and how I resolved it.
The Issue
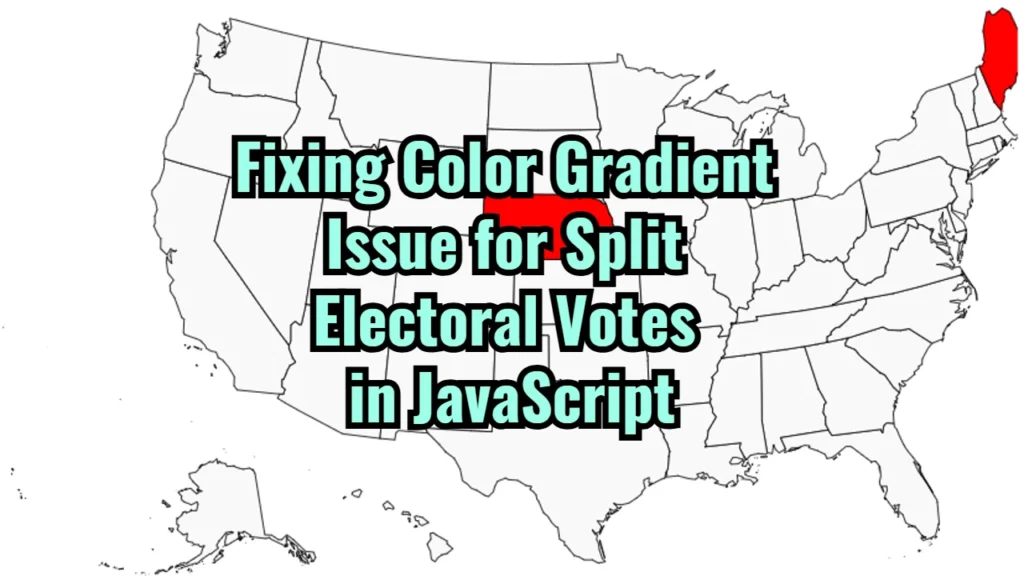
In Maine and Nebraska, which allow split electoral votes, I wanted the app to display a red and blue gradient based on the split between Democratic and Republican votes. The problem was that when the user assigned all votes to Republicans (e.g., 0 for Democrats and 5 for Republicans), the fields displayed a gradient that mixed red and blue, instead of being solid red.
This incorrect gradient appeared in two cases:
- 0 Democratic and 4 Republican votes in Maine.
- 0 Democratic and 5 Republican votes in Nebraska.
In both cases, the fields should have been entirely red since all electoral votes went to the Republican side.
The Cause of the Issue
The problem lay in how the applySplitColor function was calculating and applying the gradient. Here’s what was happening:
- Gradient Calculation: The
applySplitColorfunction calculated a gradient based on the percentage of Democratic and Republican votes. When Democrats had zero votes, the code still created a gradient starting from blue to red, even though blue wasn’t required. - Misinterpreted Zero Value: When the Democratic votes were set to zero, the code didn’t recognize that this meant only the red color was needed. Instead, it interpreted the zero value as part of the gradient and created an incorrect blend with blue.
The Solution
To fix this, I updated the applySplitColor function to handle cases where either Democratic or Republican votes are zero. When either party’s votes are zero, the function now skips the gradient entirely and applies a solid color based on the majority vote. Here’s the updated code for the applySplitColor function:
function applySplitColor(stateId, demVotes, repVotes) {
    const stateElement = document.getElementById(stateId);

    // Calculate the percentage for the color gradient
    const totalVotes = demVotes + repVotes;
    if (demVotes === 0) {
        // Apply a solid red color if all votes are Republican
        stateElement.style.fill = "red";
        return;
    } else if (repVotes === 0) {
        // Apply a solid blue color if all votes are Democrat
        stateElement.style.fill = "blue";
        return;
    }

    const demPercentage = (demVotes / totalVotes) * 100;
    const repPercentage = (repVotes / totalVotes) * 100;

    const svgNS = "http://www.w3.org/2000/svg";
    const defs = document.querySelector("svg defs") || document.createElementNS(svgNS, "defs");

    // Create a unique gradient ID for this state and remove any existing gradient with the same ID
    const gradientId = `${stateId}-gradient`;
    const existingGradient = document.getElementById(gradientId);
    if (existingGradient) {
        existingGradient.remove();
    }

    // Create a new linear gradient for the updated color
    const gradient = document.createElementNS(svgNS, "linearGradient");
    gradient.id = gradientId;
    gradient.setAttribute("x1", "0%");
    gradient.setAttribute("y1", "0%");
    gradient.setAttribute("x2", "0%");
    gradient.setAttribute("y2", "100%");

    // Set up gradient stops based on vote percentages
    const stop1 = document.createElementNS(svgNS, "stop");
    stop1.setAttribute("offset", `${demPercentage}%`);
    stop1.setAttribute("stop-color", "blue");
    gradient.appendChild(stop1);

    const stop2 = document.createElementNS(svgNS, "stop");
    stop2.setAttribute("offset", `${repPercentage}%`);
    stop2.setAttribute("stop-color", "red");
    gradient.appendChild(stop2);

    // Append the new gradient to defs and apply it to the state element
    defs.appendChild(gradient);
    document.querySelector("svg").appendChild(defs);
    stateElement.style.fill = `url(#${gradientId})`;
}
How This Solves the Problem
In this revised code, the function checks if either demVotes or repVotes is zero before calculating the gradient. If all votes are Republican, it applies a solid red color, and if all votes are Democrat, it applies a solid blue color. Only when there are split votes does the function proceed with creating a gradient.
This small adjustment ensures that the map accurately represents the voting distribution and eliminates unintended color mixing for zero-vote cases.
Final Thoughts
This was a great reminder of the importance of accounting for edge cases, especially when using dynamic color representations. By refining this logic, the app now displays the expected colors and gives a clear, visually accurate representation of the electoral vote splits in Maine and Nebraska.


