Today, I’ve outlined a simplified method for automating functional and integration testing with Postman and stress and performance testing with JMeter, all integrated into a GitHub Actions workflow. You will discover how to seamlessly incorporate Postman tests to verify API functionality and then utilize JMeter to conduct stress tests and evaluate your API’s performance under heavy load. This strategy merges the advantages of both tools, ensuring your API operates correctly while managing traffic surges effectively.
Check out the GitHub Repository here:
https://github.com/NoToolsNoCraft/Postman-Integration-Jmeter-Stress-test
Basic setup
Follow these initial installation steps:
- Create a project folder
- Update it to Visual Studio Code
- Install a package.json
npm init -y - Install Newman
npm install newman –save-dev - Create a Postman folder in the project folder, and inside it, add the exported Postman test
- Create a Jmeter folder in the project folder, and inside it, add the exported Jmeter test
- Update it to GitHub
- Setup GitHub Actions and run it
Postman Functional and Integration Test
The Postman test, in this case, is relatively simple. There is one request that looks like this:
Request: GET
Endpoint: https://account-manager-app-express-mong-production.up.railway.app/api/users
Headers: none
Body: none
Test script:
// Parse the response body as JSON
const jsonData = pm.response.json();


// Validate status code
pm.test("Status code is 200", function () {
    pm.response.to.have.status(200);
});

// Ensure the response is an array
pm.test("Response is an array", function () {
    pm.expect(jsonData).to.be.an("array");
});

// Check that each object in the array contains the correct fields
jsonData.forEach((item, index) => {
    pm.test(`Item ${index + 1}: has required fields`, function () {
        pm.expect(item).to.have.property("_id").that.is.a("string");
        pm.expect(item).to.have.property("name").that.is.a("string");
        pm.expect(item).to.have.property("password").that.is.a("string");
        pm.expect(item).to.have.property("__v").that.is.a("number");
    });
});

// Validate specific constraints if needed
pm.test("Passwords are not empty", function () {
    jsonData.forEach(item => {
        pm.expect(item.password).to.not.be.empty;
    });
});

// Check if there are at least 1 user in the response
pm.test("Response contains at least 1 user objects", function () {
    pm.expect(jsonData.length).to.be.at.least(1);
});
Expected result:
- Status code is 200
- Response is an array
- Item 1: has required fields
- Item 2: has required fields
- Item 3: has required fields
- Passwords are not empty
- Response contains at least 1 user objects
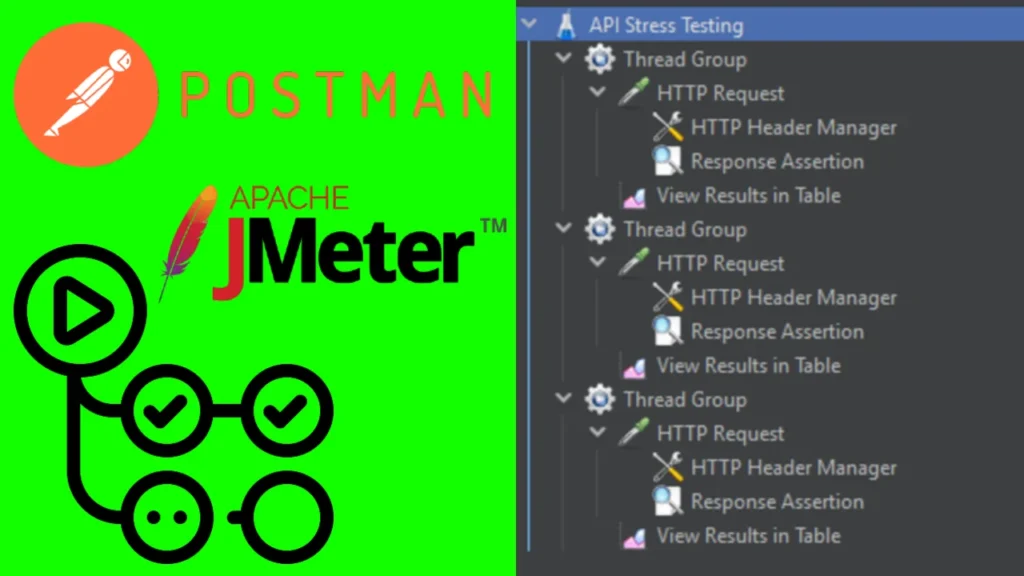
JMeter Stress Performace test
When it comes to the JMeter test setup, you can see it on the thumbnail image at the top of this post. Here is a brief explanation:
Prerequisites:
- Install JMeter: Ensure you have JMeter installed on your machine. You can download it from Apache JMeter.
- Test Target URL: The test plan is designed to perform stress testing on the URL
https://account-manager-app-express-mong-production.up.railway.app/api/users. Make sure this API endpoint is up and accessible.
Steps to Set Up the JMeter Test:
- Launch JMeter:
- Open JMeter by running the
jmeter.batfile on Windows orjmeter.shfile on Linux/Mac, located in thebindirectory of the JMeter installation folder.
- Open JMeter by running the
- Create a New Test Plan:
- In the JMeter GUI, create a new test plan by clicking
File>New.
- In the JMeter GUI, create a new test plan by clicking
- Set Up the Test Plan:
- Right-click on the Test Plan in the left-hand pane and choose
Add>Threads (Users)>Thread Group. - In the Thread Group configuration:
- Set Number of Threads to
10(this determines how many virtual users will be simulated). - Set Ramp-Up Period to
30(this is the time in seconds over which the threads will be started). - Set Loop Count to
100(this defines how many times the test will run).
- Set Number of Threads to
- Right-click on the Test Plan in the left-hand pane and choose
- Add HTTP Request to the Thread Group:
- Right-click on the Thread Group and select
Add>Sampler>HTTP Request. - In the HTTP Request configuration:
- Set Server Name or IP to
account-manager-app-express-mong-production.up.railway.app. - Set Protocol to
https. - Set Path to
/api/users(this is the API endpoint you want to test). - Set Method to
GET.
- Set Server Name or IP to
- Right-click on the Thread Group and select
- Add HTTP Header Manager:
- Right-click on the HTTP Request and select
Add>Config Element>HTTP Header Manager. - In the HTTP Header Manager, click Add and set:
- Name to
Content-Typeand Value toapplication/json.
- Name to
- Right-click on the HTTP Request and select
- Add Response Assertion:
- Right-click on the HTTP Request and select
Add>Assertions>Response Assertion. - In the Response Assertion, set:
- Field to Test to
Response Code. - Add Expected Response Codes:
200(this checks if the server returns a200 OKstatus).
- Field to Test to
- Right-click on the HTTP Request and select
- Add Result Collector:
- Right-click on the Thread Group and select
Add>Listener>View Results in Table. - This will display the results of your test in a table format.
- Right-click on the Thread Group and select
- Add Additional Thread Groups (Optional):
- To simulate different levels of load, you can add more Thread Groups with varying numbers of threads and ramp-up periods:
- Right-click on the Test Plan and select
Add>Threads (Users)>Thread Group. - Change the number of threads (e.g.,
50and100), ramp-up time, and loops as desired. - Add an HTTP Request, HTTP Header Manager, and Response Assertion to each new thread group following the same procedure as before.
- Right-click on the Test Plan and select
- To simulate different levels of load, you can add more Thread Groups with varying numbers of threads and ramp-up periods:
- Save the Test Plan:
- Once everything is configured, save your test plan by clicking
File>Save As. Choose a location and provide a file name.
- Once everything is configured, save your test plan by clicking
Running the Test:
- Run the Test:
- Click on the green Start button in the JMeter GUI to begin running the test. JMeter will simulate the load on the API as defined in the Thread Group configuration.
- Monitor the Results:
- The View Results in Table listener will show you the results of each request made during the test. You can analyze response codes, latency, and other metrics.
- Review Results:
- After the test completes, review the results to identify any performance bottlenecks or errors.
- If necessary, adjust the number of threads, ramp-up time, or other parameters and rerun the test.
- Save and Analyze Test Results:
- You can export the results from the View Results in Table listener to a CSV or XML file for further analysis.
Example Summary of Configuration:
- Number of Threads:
10,50,100(for different load levels) - Ramp-Up Period:
30or50(depending on the thread group) - Loop Count:
100 - API URL:
https://account-manager-app-express-mong-production.up.railway.app/api/users - Expected Response Code:
200 OK - Content-Type Header:
application/json
GitHub Actions
Here is the GitHub Actions Workflow code used:
name: Postman Functional/Integration + Jmeter Stress Performance test

on:
  workflow_dispatch:

jobs:
  api-tests:
    runs-on: ubuntu-latest

    steps:
    - name: Checkout Repository
      uses: actions/checkout@v3

    - name: Set Up Node.js
      uses: actions/setup-node@v3
      with:
        node-version: '16.x'

    - name: Install Dependencies
      run: npm ci

    - name: Run Postman Test
      run: newman run "Postman/Retrieve all items in the database.postman_collection.json"

    - name: Install OpenJDK 8
      run: sudo apt-get install openjdk-8-jdk

    - name: Download and Install JMeter 5.5
      run: |
        wget https://archive.apache.org/dist/jmeter/binaries/apache-jmeter-5.5.tgz
        tar xf apache-jmeter-5.5.tgz
        echo "$PWD/apache-jmeter-5.5/bin" >> $GITHUB_PATH

    - name: Configure JMeter XStream Security
      run: |
        echo "xstream.security.allowAll=org.apache.jmeter.save.ScriptWrapper" >> $PWD/apache-jmeter-5.5/bin/jmeter.properties

    - name: List JMeter Directory
      run: ls -R apache-jmeter-5.5

    - name: Run JMeter Tests
      run: jmeter -n -t Jmeter/API_Stress_Testing.jmx -l results.jtl
This GitHub Actions workflow is designed to execute both functional/integration tests using Postman and stress/performance tests using JMeter. Here’s a breakdown of the workflow and its steps:
Workflow Trigger
- Trigger: This workflow is triggered manually via
workflow_dispatch, meaning it must be initiated by a user through the GitHub Actions interface.
Jobs
api-tests Job:
- Runs on: Ubuntu latest version (
ubuntu-latest), which is the virtual environment used for this job.
Steps
- Checkout Repository:
- Uses the
actions/checkout@v3action to check out the repository’s code, ensuring the job works with the latest code in the repository.
- Uses the
- Set Up Node.js:
- Uses
actions/setup-node@v3to set up Node.js version16.x. This is needed to run the Postman tests, as Newman (the command-line tool for Postman) depends on Node.js.
- Uses
- Install Dependencies:
- Runs
npm ci, which installs dependencies based on thepackage-lock.jsonfile. This step ensures the dependencies are set up correctly for running the Postman tests.
- Runs
- Run Postman Test:
- Executes the Postman collection
Retrieve all items in the database.postman_collection.jsonusing Newman (a command-line tool for Postman). This step is used for functional/integration testing of an API.
- Executes the Postman collection
- Install OpenJDK 8:
- Installs OpenJDK 8 via
sudo apt-get install openjdk-8-jdk. JDK 8 is necessary for running JMeter, as it is a Java-based tool.
- Installs OpenJDK 8 via
- Download and Install JMeter 5.5:
- Downloads the JMeter 5.5 binary archive from the Apache website and extracts it.
- It adds the JMeter binary path (
$PWD/apache-jmeter-5.5/bin) to the GitHub Actions environment ($GITHUB_PATH), making JMeter commands available for later steps.
- Configure JMeter XStream Security:
- Modifies the JMeter configuration to allow for additional security settings, specifically configuring XStream (used by JMeter for serialization) to allow a specific class (
org.apache.jmeter.save.ScriptWrapper).
- Modifies the JMeter configuration to allow for additional security settings, specifically configuring XStream (used by JMeter for serialization) to allow a specific class (
- List JMeter Directory:
- Runs
ls -R apache-jmeter-5.5to recursively list the files in the JMeter installation directory, allowing you to verify the contents of the directory.
- Runs
- Run JMeter Tests:
- Executes JMeter in non-GUI mode (
-n) with a specified test plan (Jmeter/API_Stress_Testing.jmx) and stores the results in a JTL file (results.jtl). This step performs stress/performance testing on the API.
- Executes JMeter in non-GUI mode (
Summary
This workflow is used to:
- Run functional and integration tests on an API using Postman (via Newman).
- Perform stress/performance testing on the same API using JMeter.
It automates the process of testing both the functional correctness and the performance scalability of the API through a series of predefined tests.