In performance testing, we need to evaluate how a system behaves under different types of load conditions. One critical scenario is spike testing, which simulates sudden, extreme surges in user traffic to uncover potential performance bottlenecks, crashes, or instability. Let’s walk through a spike testing setup and explain how we structured the test to assess system resilience under rapid load fluctuations.
Why Spike Testing?
Spike testing is a non-linear load test designed to simulate an abrupt rise in users accessing the system, followed by an equally sudden drop. Unlike step load testing, where user count increases gradually, spike testing applies sharp traffic bursts to stress test the infrastructure. This helps us answer key questions:
- Can the system handle sudden increases in user load without crashing?
- How quickly does it recover when the load drops?
- Are there any critical bottlenecks that could degrade user experience?
Test Design
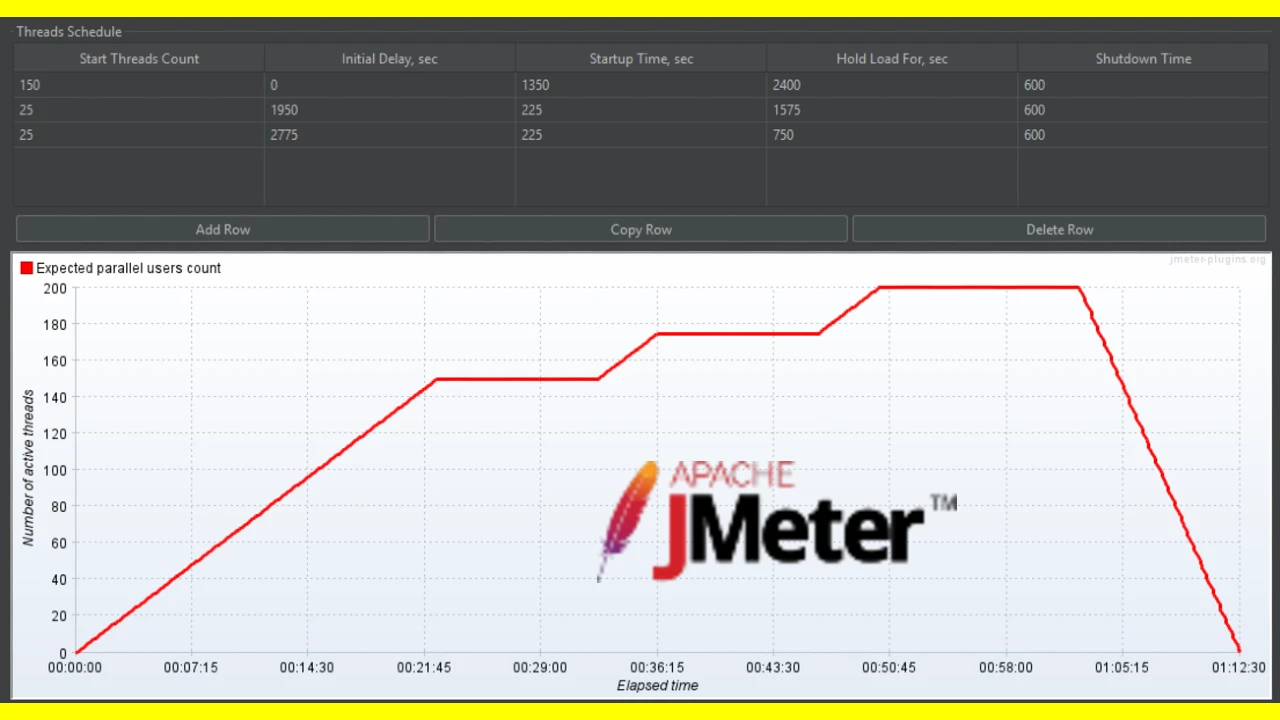
For this test, I’ve used the Ultimate Thread Group feature, that is available through installing a JMeter plugin. I structured the load in three distinct spikes, increasing user traffic almost instantly and observing how the system responds. Below is the test plan:
| Stage | User Count (Start Threads Count) | Initial Delay (seconds) | Ramp-Up (Seconds) | Hold Time (Seconds) | Ramp-Down (Seconds) |
|---|---|---|---|---|---|
| Initial | 150 | 0 | 10 | 300 | 10 |
| Intermediate | 175 | 310 | 10 | 300 | 10 |
| Final | 200 | 620 | 10 | 300 | 10 |
Key Design Choices:
- Fast Ramp-Up (10s): Users are added almost instantly to simulate a sudden spike.
- Short Hold Time (300s): The system maintains peak load briefly to test resilience.
- Quick Ramp-Down (10s): Users drop off rapidly to evaluate recovery time.
Running the Spike Test in PowerShell
Why Use PowerShell?
PowerShell allows us to automate the execution of our JMeter spike test, ensuring consistency and efficiency. By running the test from the command line, we can generate logs and reports without using the JMeter GUI, which is useful for continuous integration (CI) and automated performance testing.
Runnin tests through the JMeter GUI may slow tests down and eventually even brake them where they aren’s supposed to brake.
How to Run the Test
Follow these steps to execute the spike test in PowerShell:
- Open PowerShell and navigate to the JMeter
bindirectory:Set-Location "C:\Users\38163\Downloads\apache-jmeter-5.6.3\apache-jmeter-5.6.3\bin" - Run the JMeter test script with the following command:
./jmeter -n -t .\tests\spike.jmx -l .\logs\spike.jtl -e -o .\spike-report\-nruns JMeter in non-GUI mode.-t .\tests\spike.jmxspecifies the test plan file.-l .\logs\spike.jtlstores the results in a log file.-e -o .\spike-report\generates an HTML report in thespike-reportdirectory.
- Review the results by opening the generated report in a browser to analyze performance metrics, response times, and any system failures.
Expected Outcomes
By running this test, I aim to identify:
- System Crashes or Failures – If the system crashes or lags under the sudden load.
- Slow Response Times – Detect performance degradation when handling peak traffic.
- Recovery Behavior – How efficiently the system stabilizes after the load decreases.
How long should this test last?
To calculate the total duration of the spike test, we sum up the key phases:
- Initial Stage:
- Ramp-Up: 10s
- Hold Time: 300s
- Ramp-Down: 10s
- Total: 320s
- Intermediate Stage:
- Initial Delay: 310s (starts after Initial Stage)
- Ramp-Up: 10s
- Hold Time: 300s
- Ramp-Down: 10s
- Total: 630s (from start)
- Final Stage:
- Initial Delay: 620s (starts after Initial Stage)
- Ramp-Up: 10s
- Hold Time: 300s
- Ramp-Down: 10s
- Total: 940s (from start)
Thus, the entire test lasts 940 seconds (15 minutes and 40 seconds).